
 PremiumEND USER3 min read
Build an executive dashboard from an Excel file
A dense workbook spread across several sheets? Ask Copilot for a single “Executive Dashboard” sheet: it analyzes all your data and assembles KPIs, tables and charts so an executive grasps the situation at a glance.
✅ How to
- 1
Open the workbook you need to decode in Excel (here “eBike Inventory”: 150 products across 5 categories and 60 customer sales, scattered over several sheets) and launch Copilot. Switch to “Allow Editing” (Edit with Copilot) so it can write into the file.
- 2
Paste the request (prompt to copy below). The idea: let Copilot analyze the WHOLE workbook, then build a single sheet designed for a busy executive. Name the sheet explicitly and state its audience (“designed for an executive”): that is what steers the layout.
- 3
Let it work: Copilot explores each sheet one after another, spots the tables and summary cells, then lays out its plan (title banner, key metrics, tables, charts) before executing it step by step.
- 4
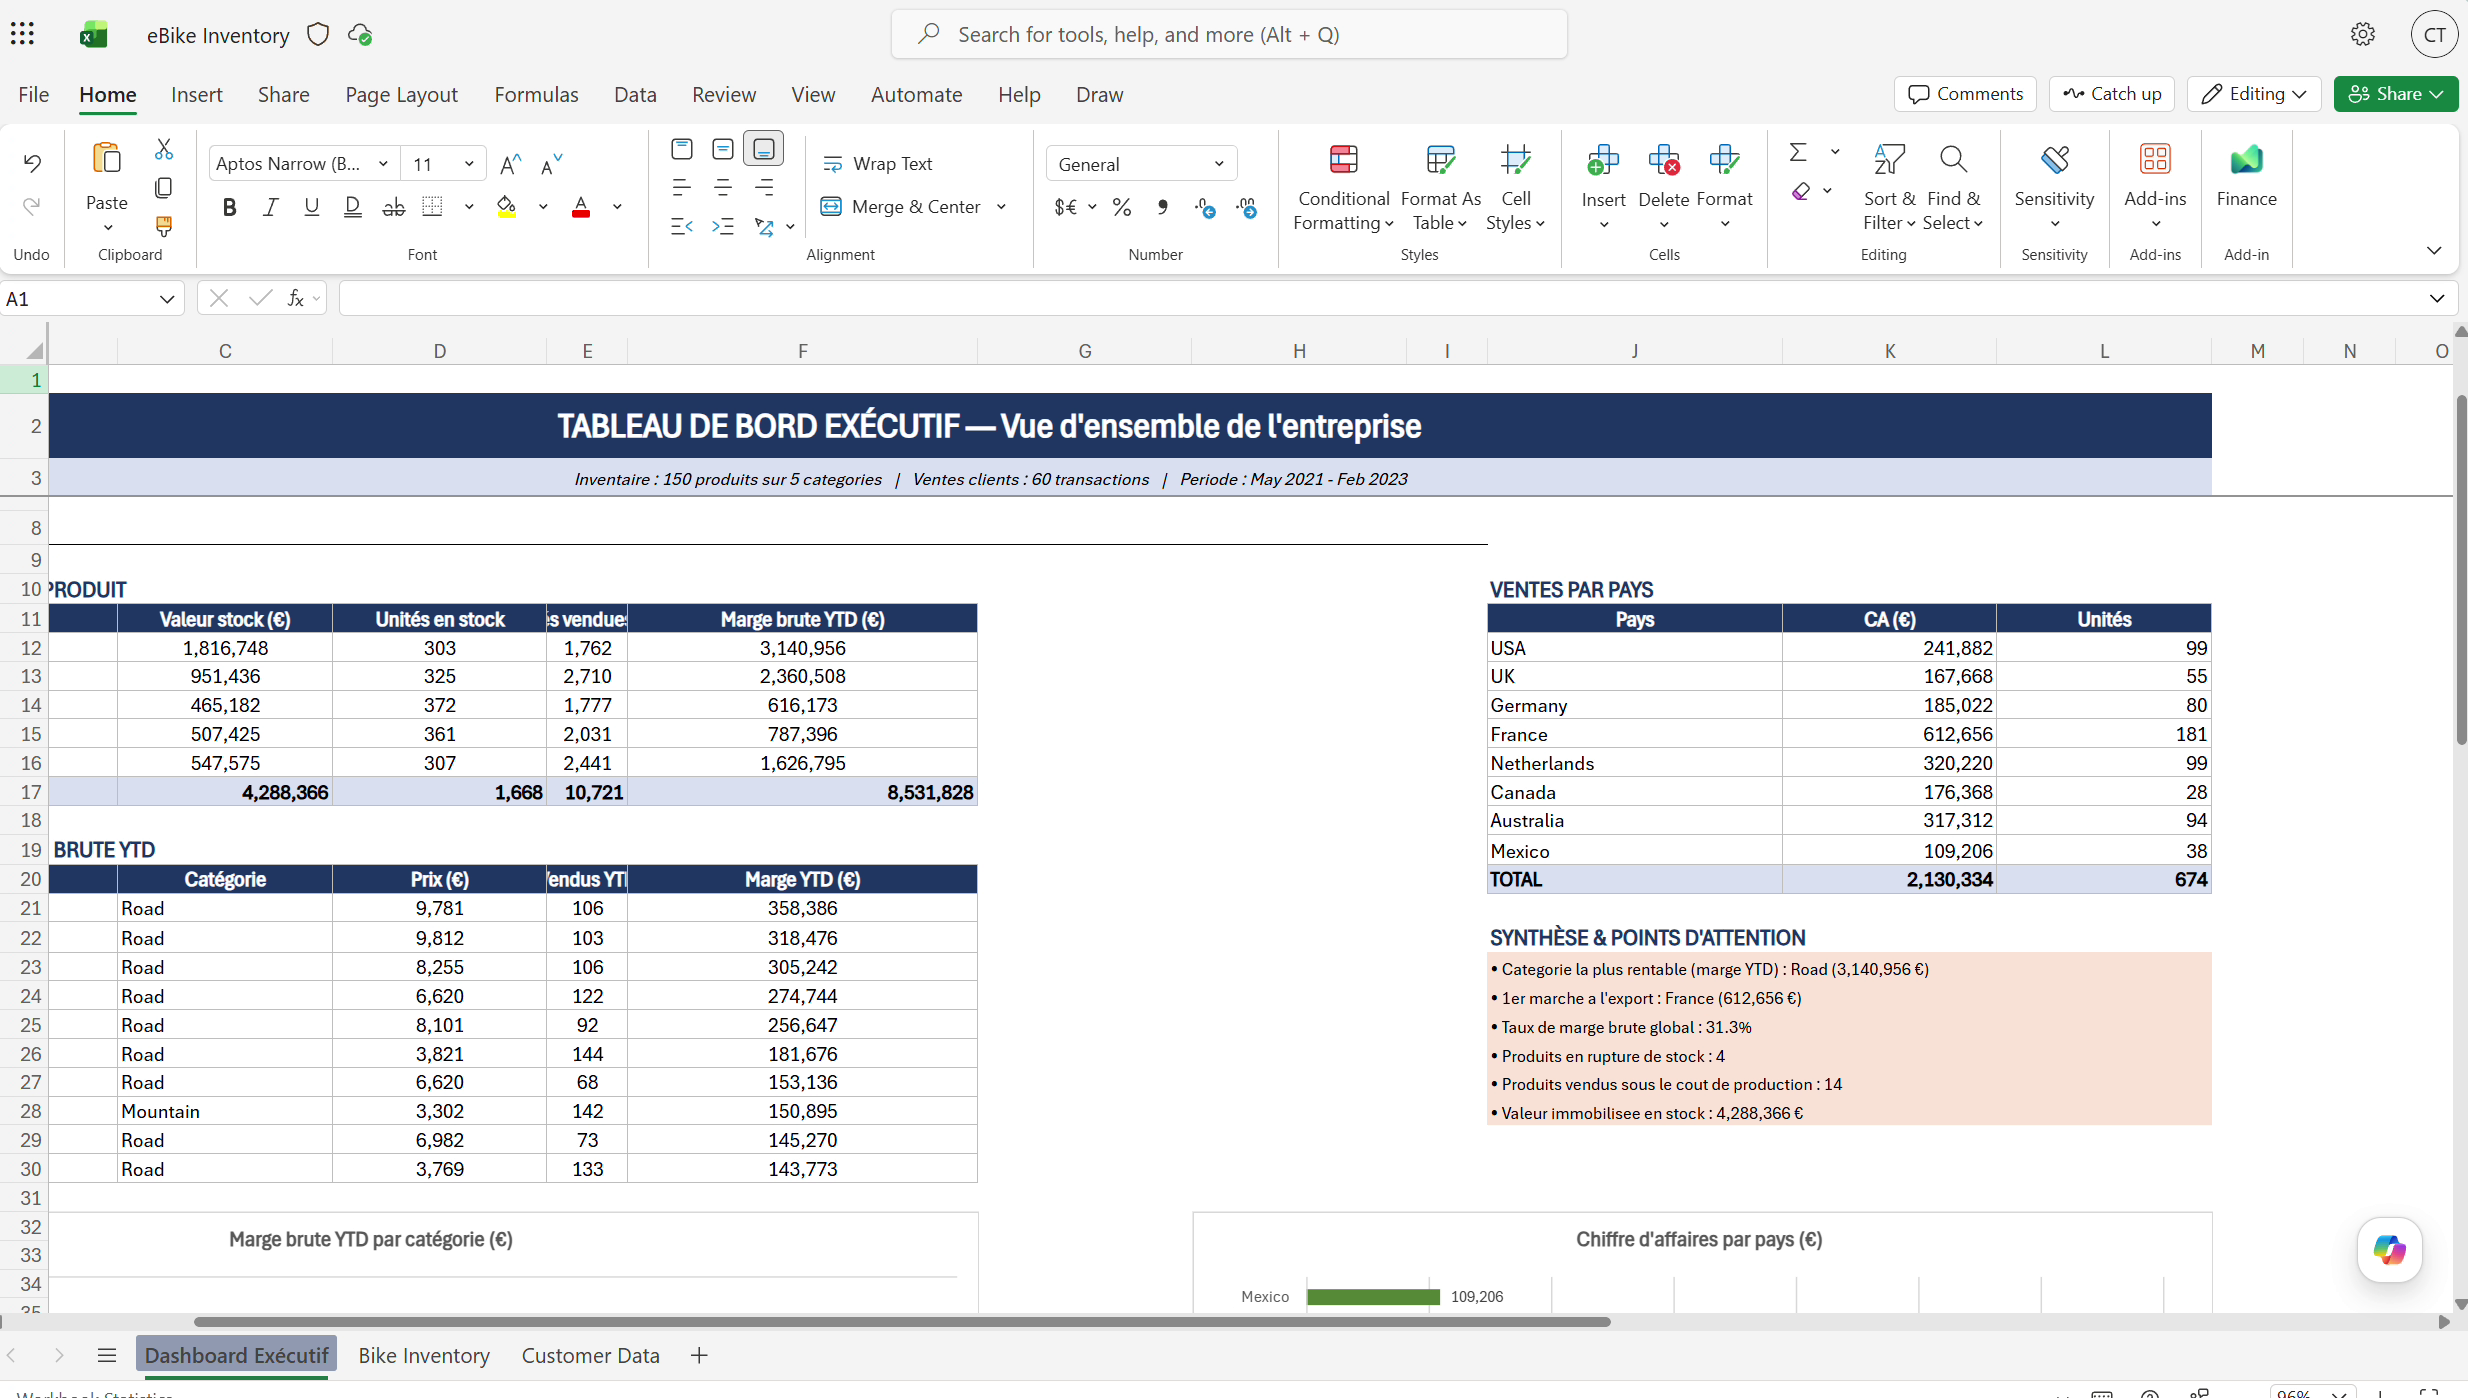
It creates a new “Executive Dashboard” sheet placed first: a title banner, key metrics (gross margin YTD, stock value, units sold…), a “Sales by country” table, a “Summary & watch points” block and several charts (columns, pie, bars).
- 5
Key point: every value is an Excel formula (COUNTIF, SUMIF, AVERAGEIF…) referencing your original tables. The dashboard stays live and recomputes on its own when the data changes. The result: open a single sheet and understand the situation at a glance.
⚡ Prompt to copy
Create a new sheet named "Executive Dashboard". Analyze all the data in the workbook and build a visual dashboard designed for an executive. The goal is for an executive to open only this sheet and immediately understand the situation.
Two prerequisites: stay in “Allow Editing” (Edit with Copilot) so it can create the sheet and charts, and note that the result is driven by formulas referencing your data, so it updates on its own. Tip: the more your request states the target audience and the goal (“an executive should understand everything from this one sheet”), the more relevant the layout.
💬 Comments
No comments yet. Be the first!
✨ Discover more
PremiumAnalyze an Excel table in plain language
Copilot understands your table's context and analyzes it in plain language, then, if you let it edit, adds columns, dashboards and charts, on a new sheet if needed.
 Premium
Analyst agent: the pocket data scientist living in your Copilot
The Analyst agent is the Microsoft Copilot agent that turns a messy spreadsheet into real business decisions, simply by chatting with it like a colleague. No need to be an analyst: you ask a question in plain language, it computes, reasons and answers. Demo with a concrete case at Nova Sports.
 Premium
Track your Copilot rollout with Copilot Dashboard
To steer adoption, the Copilot Dashboard (enabled via Viva Insights) is the best fit: track Copilot Chat and Microsoft Copilot, per app and more granularly than the native reports.