
 PremiumEND USER5 min read
Create an infographic from Notebooks, based on your own content
Notebooks (which you can open straight from OneNote) does more than gather your sources: with a license, its « Create » menu generates a full infographic from the content referenced in your notebook. Here, we use the fictional « Thunderbolt » project to turn specs into a share-ready visual.
✅ How to
- 1Notebooks, and opening it from OneNote
Copilot Notebooks are spaces where you gather everything about a topic: documents, presentations, notes, web pages. Good news: you can open a notebook straight from OneNote, the note-taking app many people already use. No need to switch tools, your notes and your notebook live in the same place.
Once your sources are gathered, Copilot can reason over them and produce different formats: audio overview, study guide, mind map… and, what we're after here, an infographic.
- 2Gather your sources in the notebook
It all starts from the content you reference. In our example, the « Thunderbolt Specifications » notebook gathers several sources around a fictional e-bike: technical specs, presentations, launch plan.
This matters: the infographic will only be generated from this content, not from made-up information. The richer and more up-to-date your sources, the more relevant and faithful the visual.
- 3Open « Create » and choose « Infographic »
In the notebook's left menu, click « Create ». Under « Quick create with Copilot », you'll find several formats: Audio overview, Mind map, Study guide… and « Infographic ».
This option is part of the advanced capabilities (labeled « Frontier ») reserved for users with a Copilot license. One click, and off you go.
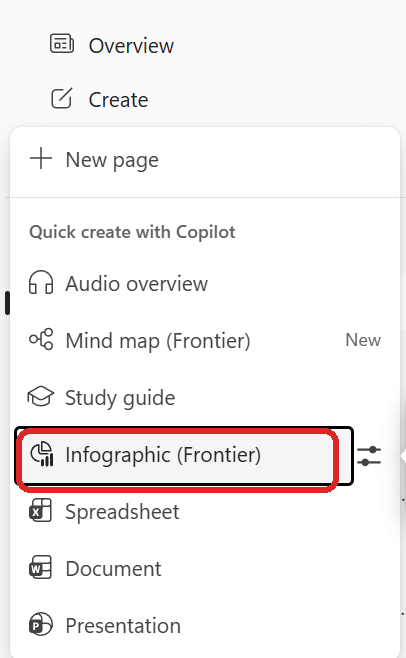
The « Create » menu: the « Infographic (Frontier) » option, for licensed users.
- 4Copilot generates the infographic from your content
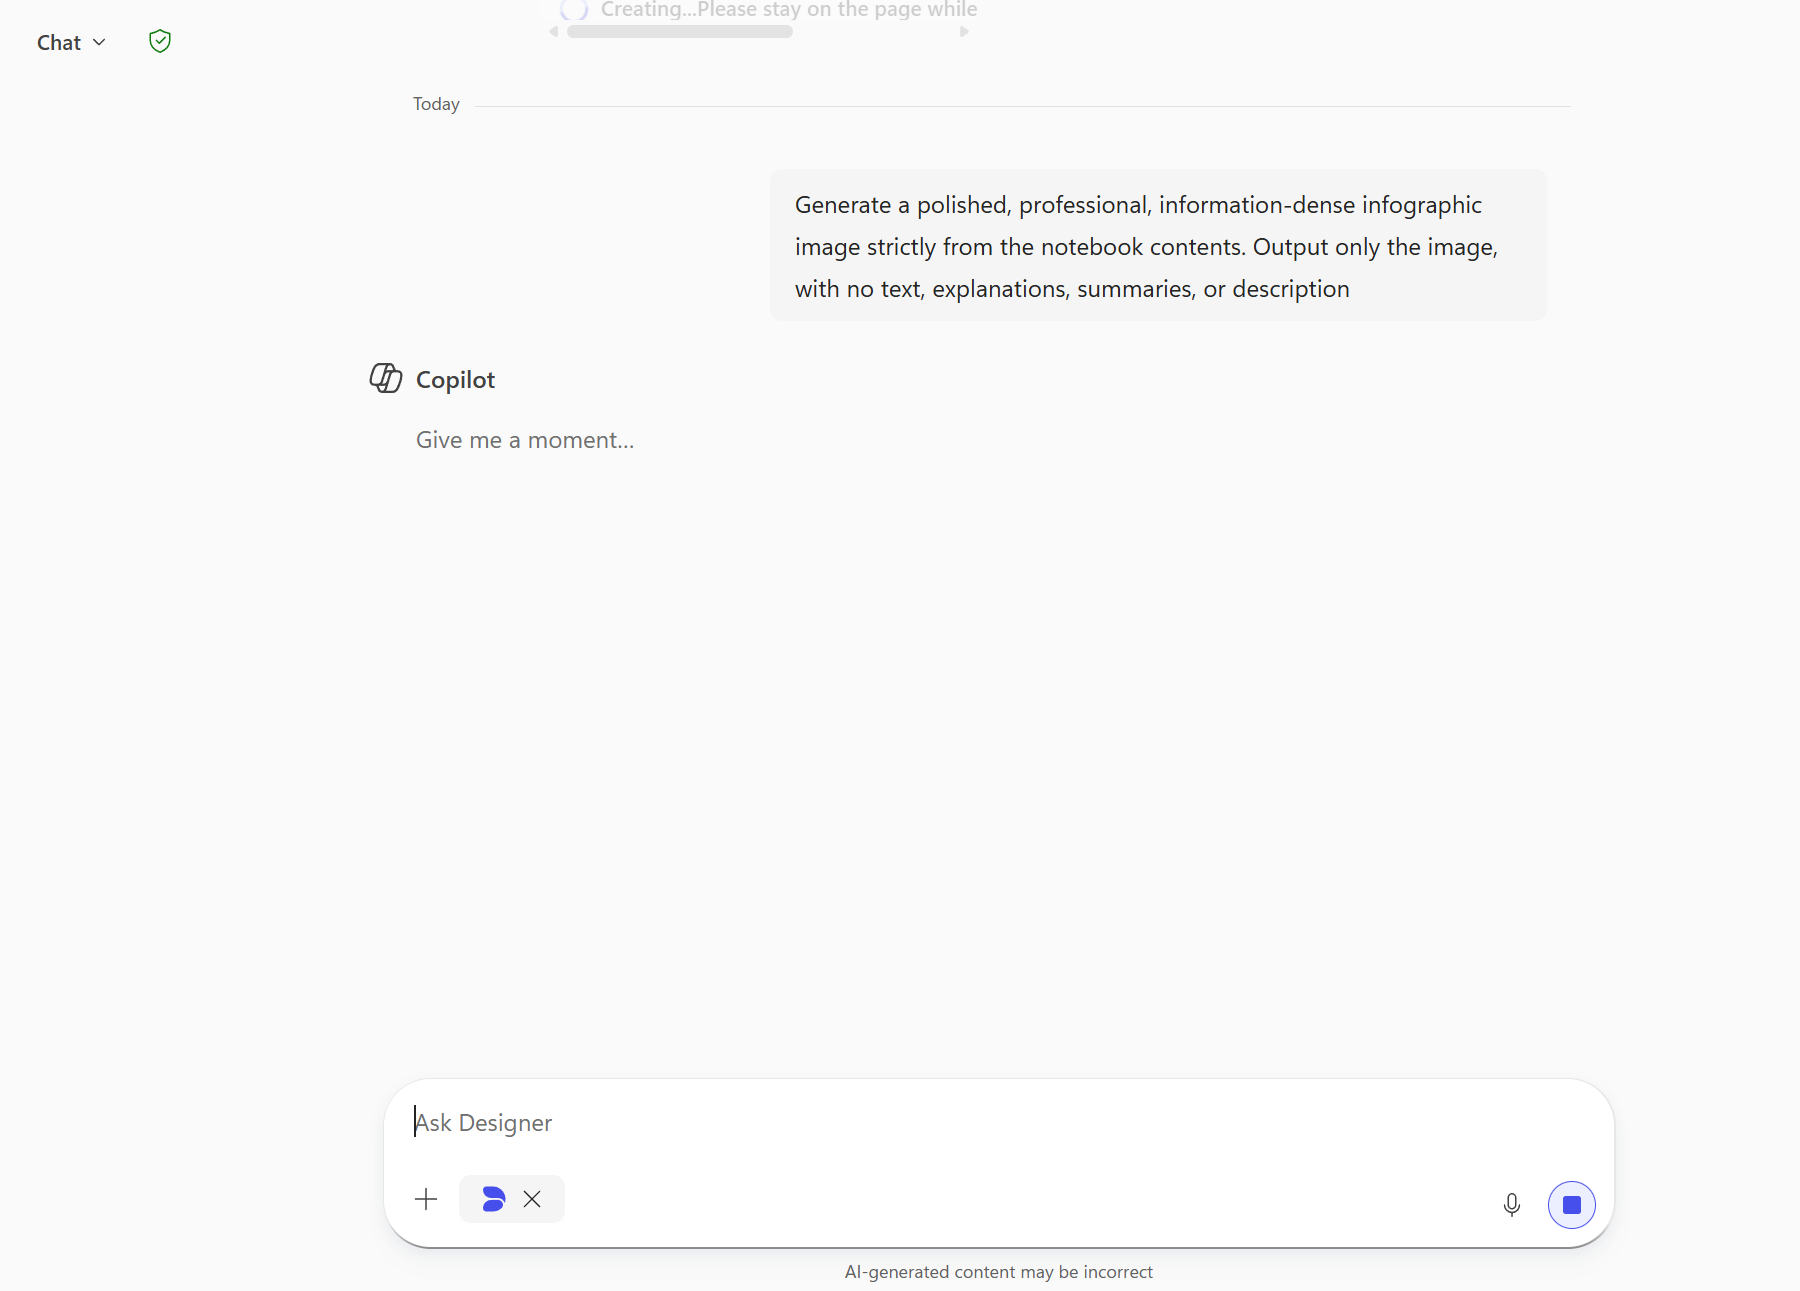
Copilot then starts creating. Behind the scenes, the instruction is clear: produce a polished, dense infographic strictly from the notebook's content. Let it work for a few moments (« Give me a moment… ») while staying on the page.
You don't have to format anything yourself: Copilot picks the structure, the charts and the information hierarchy.
- 5The result: a complete infographic, ready to download
In seconds, you get a professional visual: key figures, comparisons, charts, launch timeline, all cleanly laid out from the Thunderbolt specs.
It appears under the notebook's « Created content » (you'll find it again later), and the « Download » button lets you export it to drop into a presentation, an email or a meeting deck.
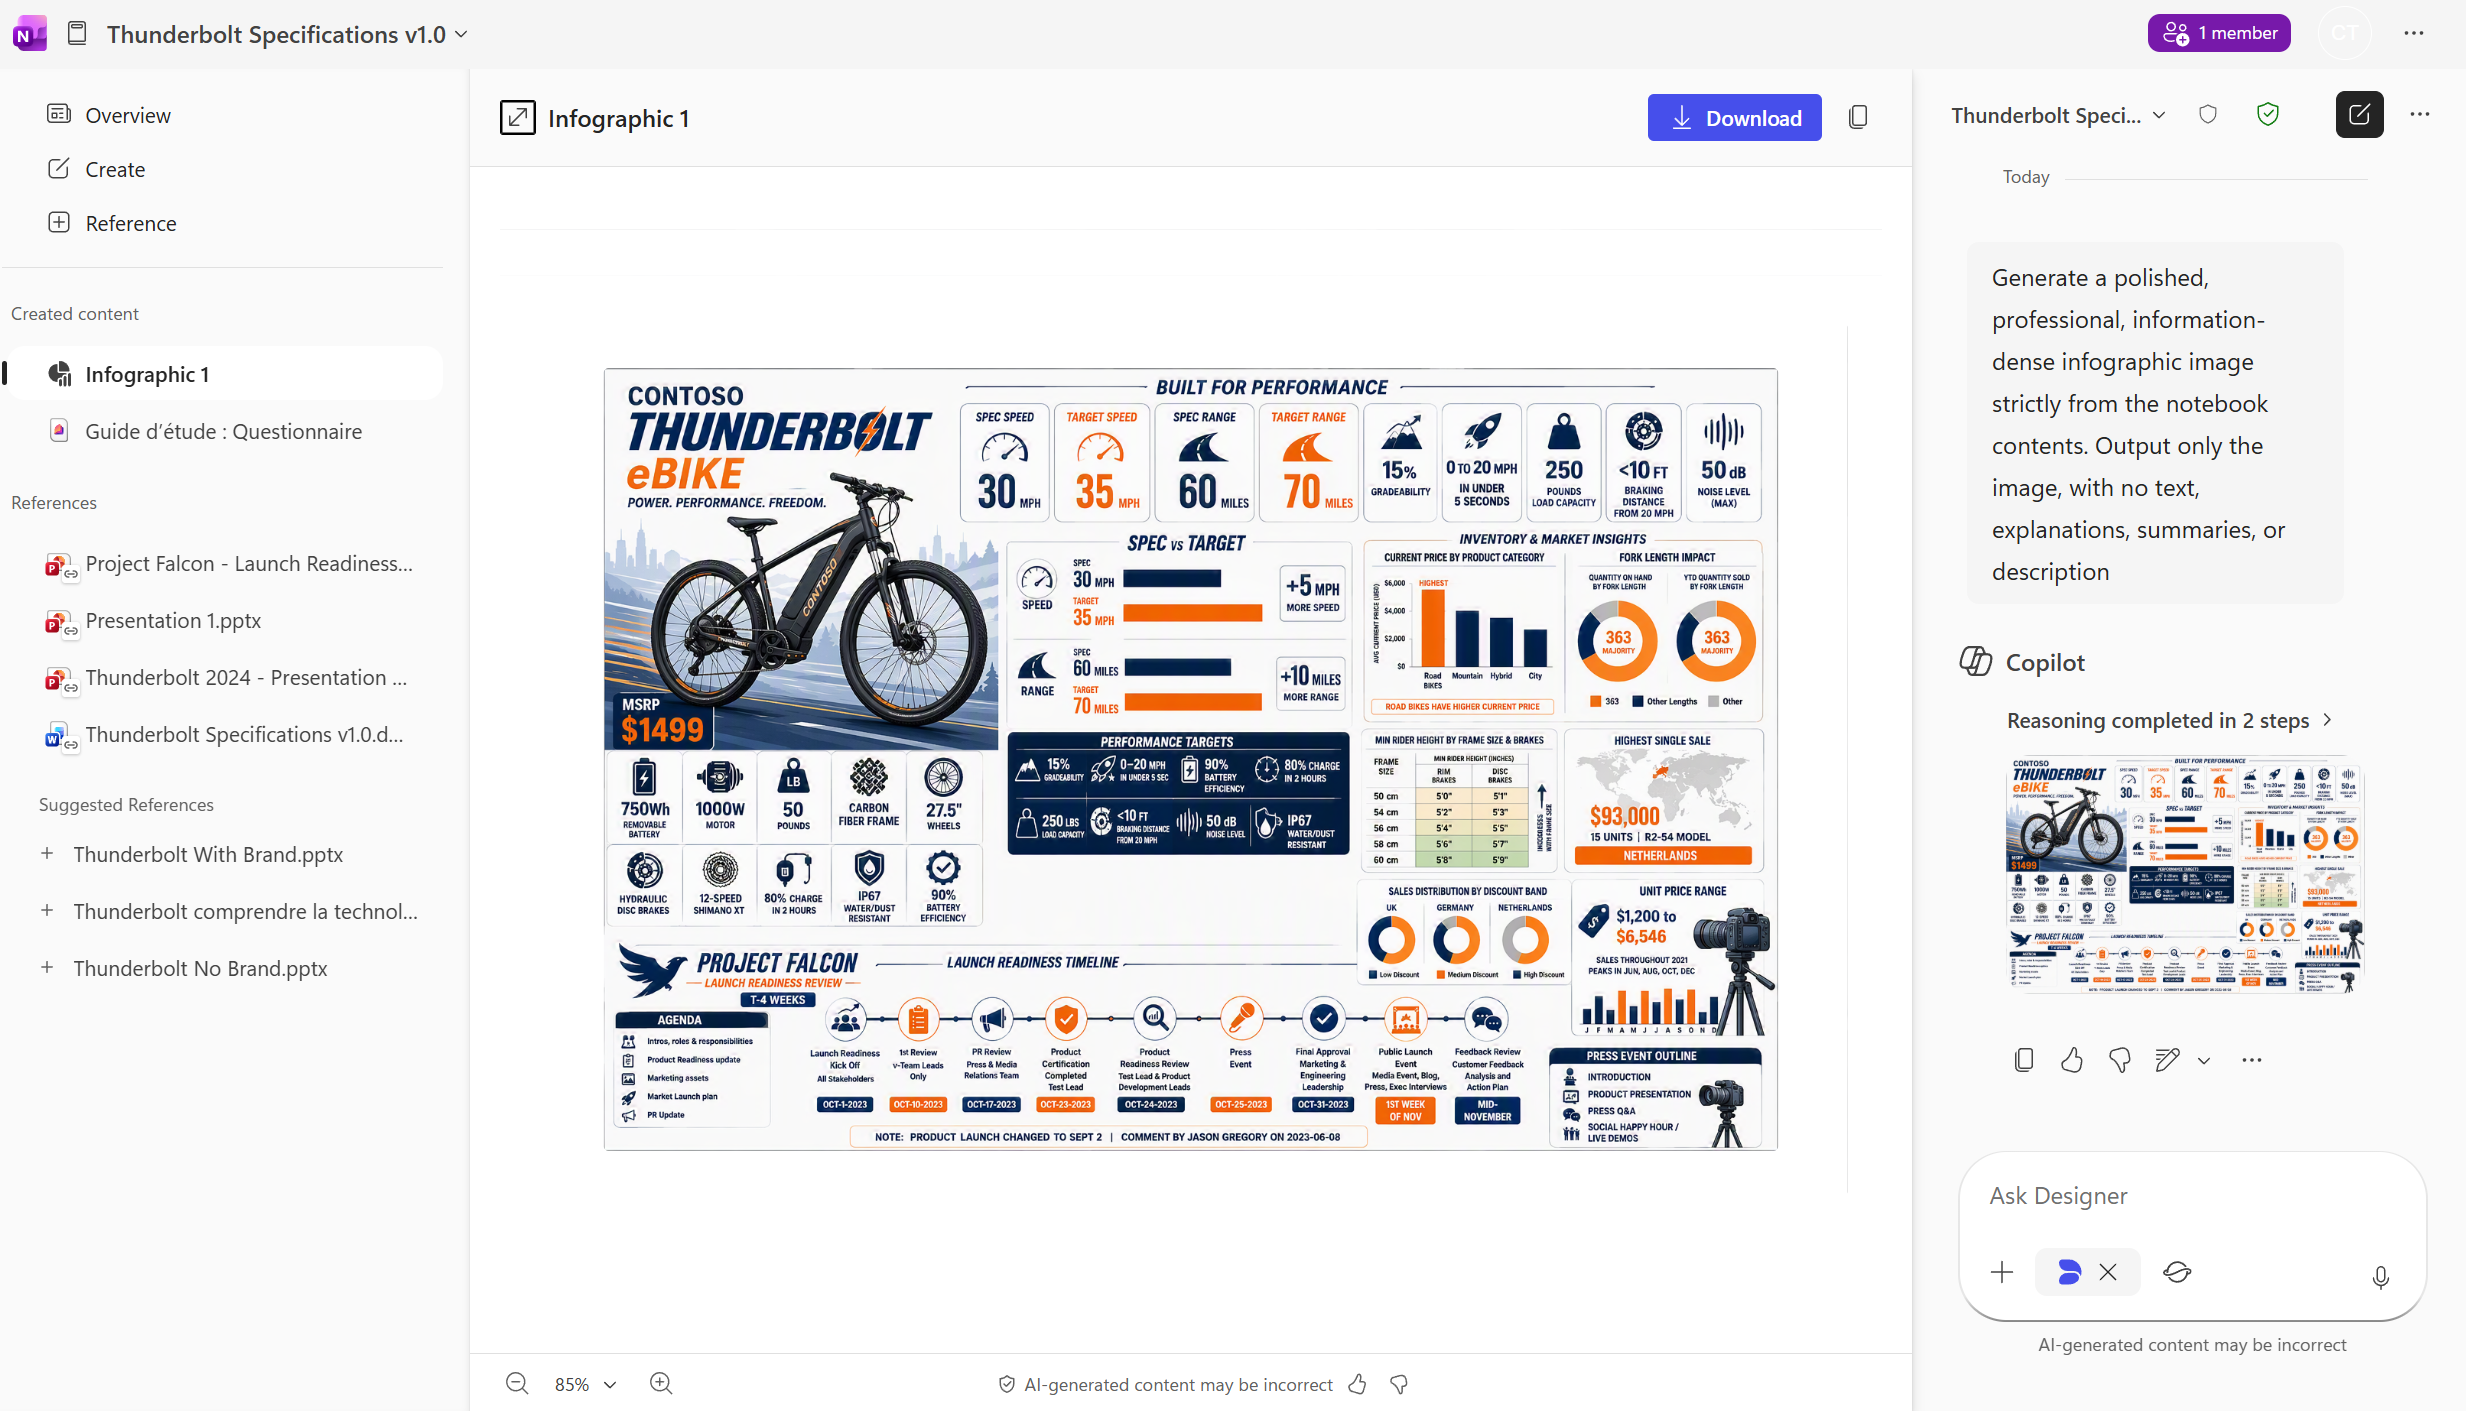
The infographic generated from the notebook sources, with the « Download » button.
- 6What to remember
Notebooks, reachable from OneNote, isn't just a binder: with a license, its « Create » menu turns the content you've gathered into a full infographic, with no design skills needed. You gather your sources, click « Infographic », Copilot lays it out, and you download it. The fastest way to go from a folder of specs to a clear, shareable visual.
Status as of September 17, 2026, subject to change: the Infographic (Frontier) feature remains in early access and may change before general availability.
💬 Comments
No comments yet. Be the first!
✨ Discover more
PremiumQuick Create in Copilot Notebooks: which format should you choose?
Audio overview, Mind map, Study guide or Infographic: see how Quick Create turns the sources in your Copilot Notebook into formats that are easy to listen to, explore, learn from or share.
PremiumStudy guide in Copilot Notebooks: turn your sources into learning material
Summary, glossary, flashcards, quiz… Study guide is one of the Quick Create formats in Copilot Notebooks: it turns your sources into a real learning kit, so you can learn and check what you've retained. Here's how to create and use it, step by step.
PremiumCreate a Copilot Notebook to organize your watch
Bundle files, chats, meetings and emails on one topic into a Copilot Notebook: a dedicated space where Copilot reasons only over your curated sources.