
 PremiumIT PRO5 min read
Set up Copilot usage tracking with the Copilot Dashboard
Turn on the Copilot Dashboard “out of the box” in a few clicks from the M365 admin center, check your org chart, then move to custom reports and Power BI only if needed.
✅ How to
- 1The approach: start simple
The Copilot Dashboard (in Viva Insights) is well documented and supports advanced configuration. But before diving in, keep it simple: aim for a quick “out of the box” activation, watch what the dashboard surfaces, and only move to advanced settings if something is missing.
- 2Turn the dashboard on (user access)
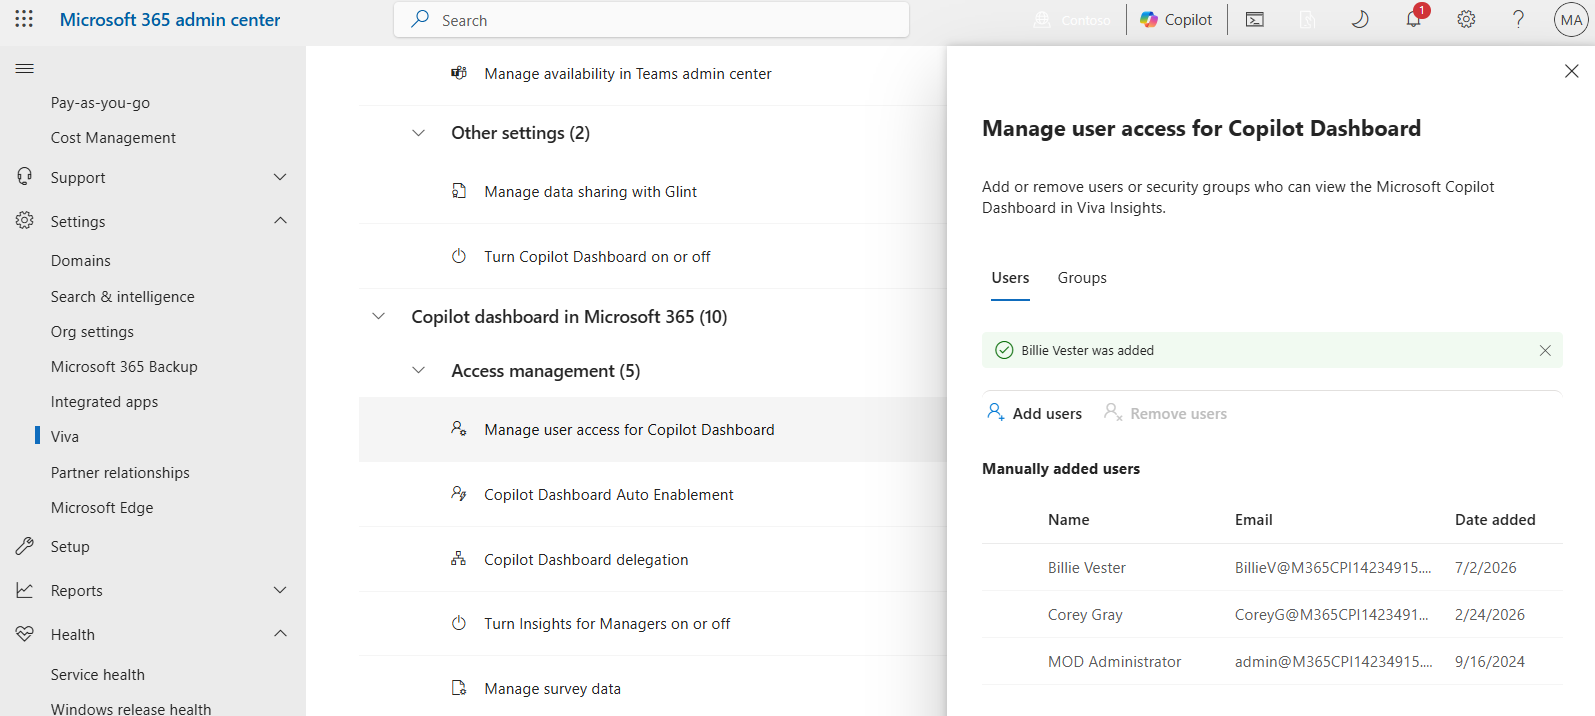
In the Microsoft 365 admin center (admin.microsoft.com), follow: Settings›Org settings›Viva›Viva Insights. In the “Copilot dashboard in Microsoft 365” section, open Access management, then “Manage user access for Copilot Dashboard”. Add the users or security groups (leaders, managers, adoption sponsors) who should view the dashboard, then confirm.
- 3Good to know: the neighbouring settings
In the same place, three useful options: “Turn Copilot Dashboard on or off” enables or disables the dashboard for the whole organization; “Copilot Dashboard Auto Enablement” automatically grants access to newly eligible managers; “Copilot Dashboard delegation” lets a manager delegate their view to an assistant. To start, the access from step 2 plus auto-enablement is enough.
- 4Check the org chart
Open the dashboard and see whether your teams and their managers show up correctly. This org chart is what lets you filter the numbers by team and by manager. If it's missing or wrong, move to the next step.
- 5If needed: upload your organizational data
When the automatic org chart is incomplete, upload an organizational data file (mapping each person to their manager, entity and site). The dashboard can then show reliable per-team segmentation. Only do this if step 4 revealed a problem.
- 6Example: the dashboard on the usage side
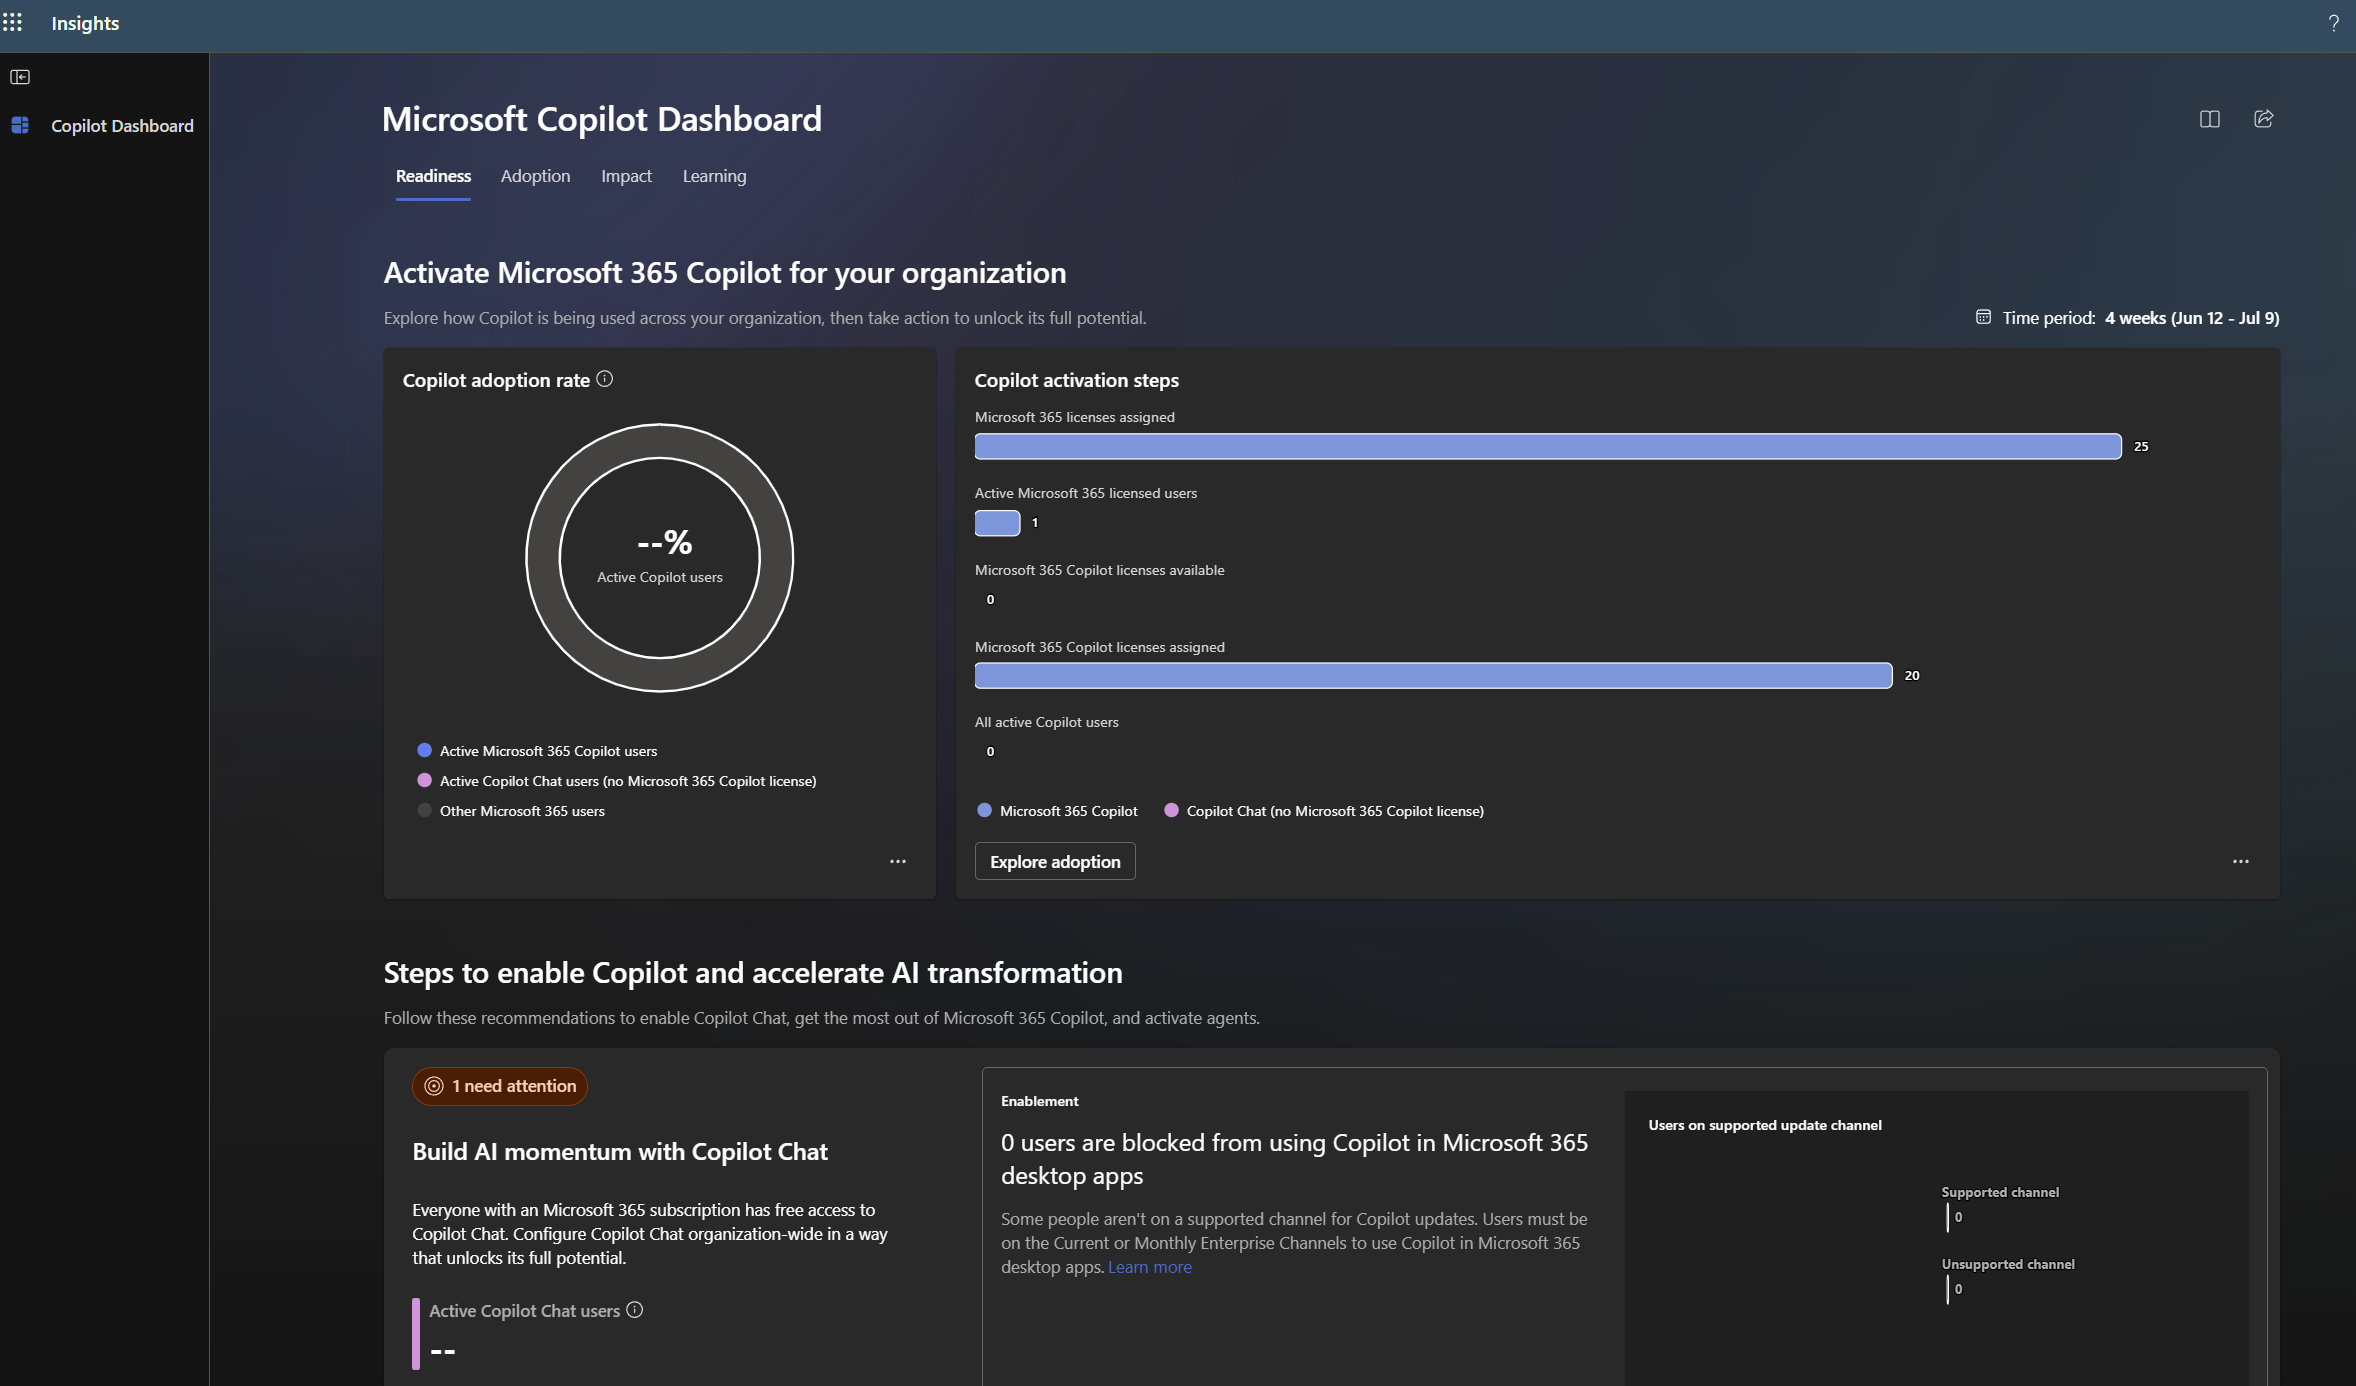
Once enabled, the Readiness tab shows the essentials at a glance: Copilot adoption rate (active M365 Copilot users vs Copilot Chat vs the rest of the organization), licenses assigned and used, and concrete recommendations to remove blockers (unsupported update channels, blocked users…). The Adoption, Impact and Learning tabs round out the view.
Start “out of the box”: grant access, enable auto-enablement, and see what the dashboard surfaces. Only upload your organizational data if the org chart is incomplete. To go further, you can then build custom reports and Power BI dashboards (Copilot Analytics). Learn refs: “Copilot Dashboard”, “Manage settings” and “Copilot Analytics / Power BI”.
📚 Official sources
💬 Comments
No comments yet. Be the first!
✨ Discover more
PremiumTrack your Copilot rollout with Copilot Dashboard
To steer adoption, the Copilot Dashboard (enabled via Viva Insights) is the best fit: track Copilot Chat and Microsoft Copilot, per app and more granularly than the native reports.
PremiumThe Frontier program: early access to Microsoft Copilot
Frontier is your door to the next Copilot features, ahead of everyone else. Here's a clear rundown of this early-access program: what it is, who it's for, how IT turns it on (with screenshots), how to spot a Frontier feature with real examples, its benefits and its caveats.
PremiumCopilot Search: find the right file using natural language
You know the document exists, but you just can't find it. Copilot's « Search » section scans all your enterprise content (SharePoint, Outlook, Teams…) and understands a request phrased in plain language. Filters, sources, recent or shared content, and even a prompt launched straight from a file: here's how to make the most of it.